

Dangerous Decompositions
These are not the calculations you are looking for

There is an ongoing meme among economics correspondents about whether we can attribute the cause of the current high rate of inflation to various parts of the economy by decomposing GDP.
The latest missive comes from the OECD which breaks down the rise in the GDP deflator into it’s constituent income components. GDP can be broken down in to
Income to workers (wages)
Income to businesses (profits)
Taxes (net subsidies) levied by governments on production
Some other less interesting areas.
Which is what the below graph shows.
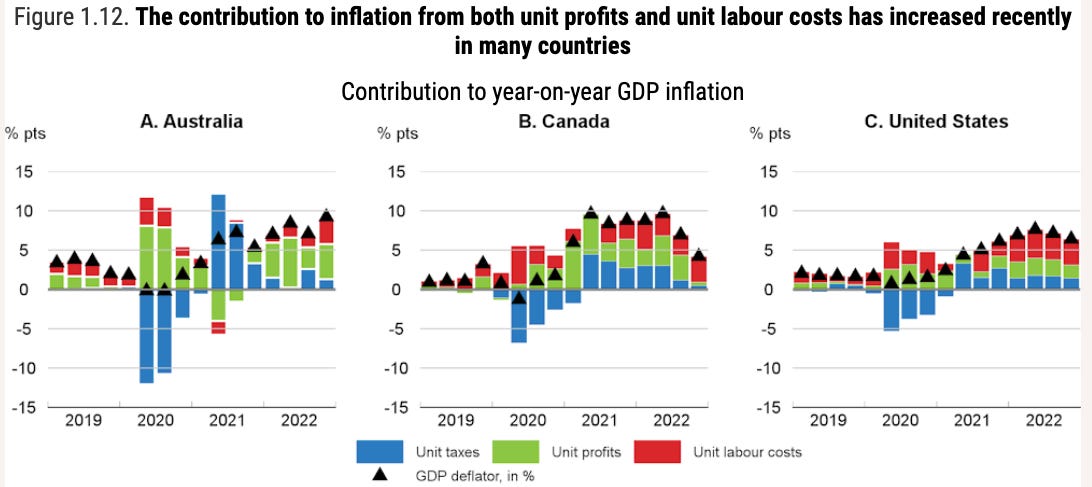
Quick aside: look at the GDP deflator in an Australian context is almost always a bad idea because it is highly sensitive to our large mining sector, which is largely owned, invested in and supplies people overseas and is largely irrelevant to Australian’s domestic inflation rate.
Staring at the Australia, one might conclude that those large green bars is evidence that the high inflation is caused by businesses profiteering.
But this is not correct. One only has to look a few inches left to 2020 to see how misleading that thinking can be.
Covid was not caused by taxes
In 2020 we experienced a massive fall in aggregate spending, caused by an entirely exogenous shock - Covid-19. This in turn caused the inflation rate to fall even further than it was in 2019.
Hopefully none of that is controversial. Yet if you were to apply “greed-flation” interpretation to the OECD chart it would imply that it was a change in “unit taxes” that caused the crash in the GDP deflator!
Obviously this is not correct. But it highlights how dangerous it can be to make casual interpretations of these decompositions.
This is not to say that Australian firms don’t exist in a cost uncompetitive market in which high markups produce fat profits at consumers expense. But that undeniably true fact is not shown by this data.