How worried should you be about the cash rate futures?
Trigger Warning: Post contains Excel Graphs
With the RBA achieving lift off from the zero lower bound the next question will be how long, how high and how fast the cash rate will rise.
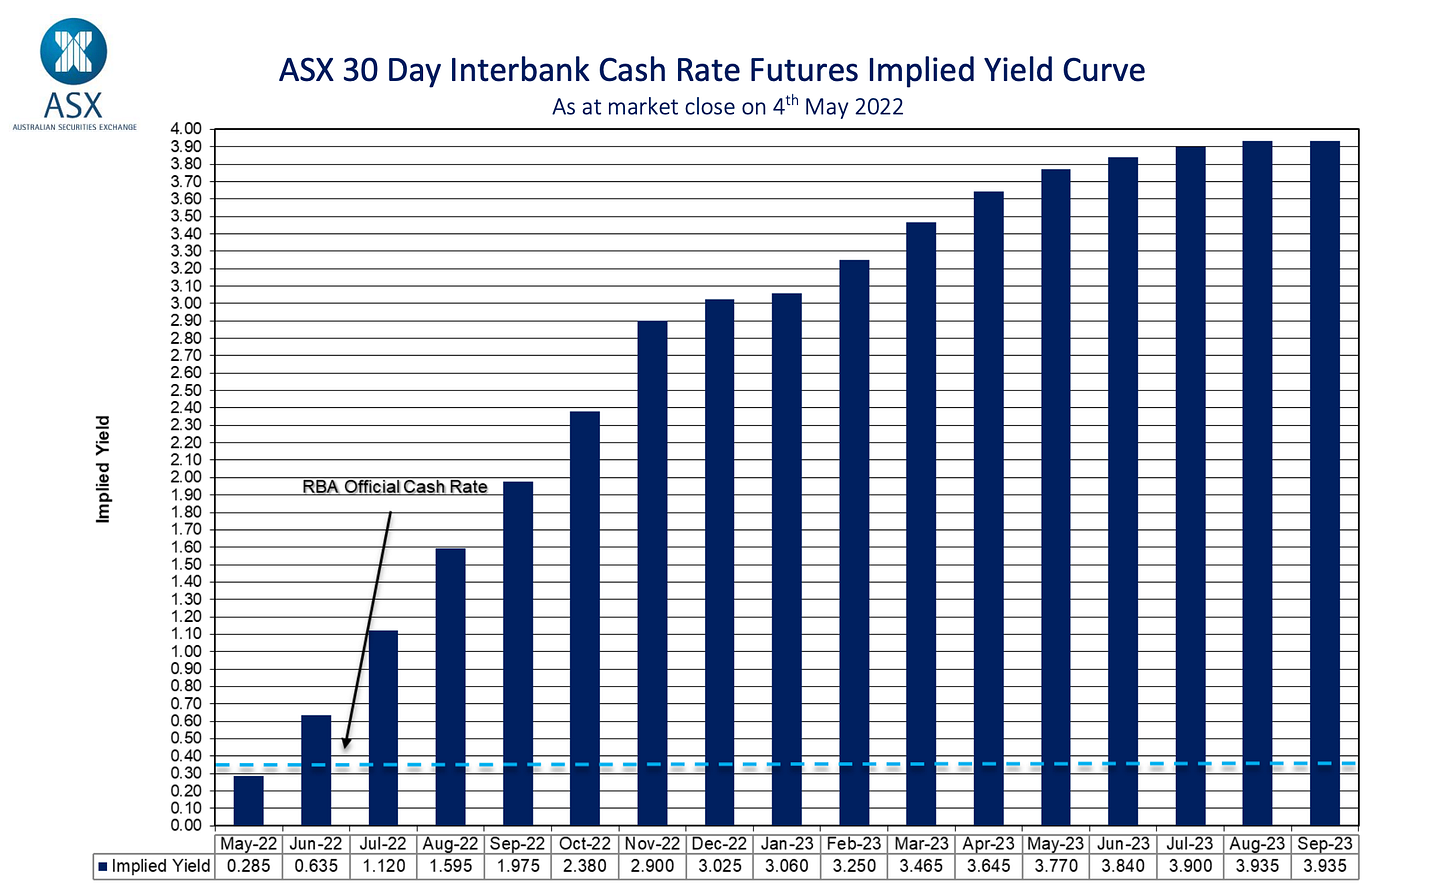
One possible answer to that question is given by cash rate futures which predict a sharp increase in the cash rate to 3.0 per cent (!?) by the end of the year. That would equate an average of 45 basis points rises for each of the 6 meetings left into 2022 - hiking every meeting and by 50 basis points more often than not!
How much weight should we place on this aggressive forecast? One way to figure this is to measure how accurate these forecasts have been in the past. Using data on cash rate forwards (handily provided by the RBA) we can calculate their historical errors and use this as a yardstick for their reliability.
The chart below shows the root mean square error of the cash rate forecasts over the forecast horizon for the cash rate futures vs errors that would be made if you just assumed the cash rate would stay at its current rate forever (a simple baseline comparison).
Interestingly, while financial markets are relatively good at predicting changes in the cash rate at shorter horizons, their performance suffers at horizons beyond 2 years.
This result is maintained even if you assess the forecasts over a constant sample (in this case forward rates from 2009-16).
What might explain the lower accuracy at longer forecast horizons? One limitation to this analysis is that nominal interest rates have been structurally trending down across almost the entire sample. Markets keep forecasting that this decline will end and rates will return to their “normal” level - but they never do.
More usefully we can use these RMSEs to calculate confidence intervals for the current cash rate forecast.
The graph below shows the path as predicted by financial markets using past errors to create confidence intervals as Peter Tulip and Stephanie Wallace do for RBA Forecasts. Assuming the errors are normally distributed, dark bands (±1 RMSE) represent the 65% interval and the lighter bands (±2 RMSE) show the 95% confidence intervals.
As this graph makes clear it would take an extremely large error for the interest rate to be below 2 per cent by the end of 2022. Perhaps the markets are wrong, or distorted in some way (these forecasts do not account for risk or term premia). But given the relatively high accuracy of the financial market forecasts over the past decade it would be foolish to dismiss them.


