

How will the gas price cap affect inflation?
Not rocket science


The Government’s price cap on natural gas came into effect in the dying days of 2022 and there has been considerable debate about how the cap will impact the outlook for inflation. Obviously there will be a direct decrease in gas prices as the price ceiling comes into force. This will lower energy bills for Australian households and price the gas-intensive goods that use it as an input in their production process. It doesn’t take a macroeconomist to see that this aspect of the policy will be deflationary - lower prices mean a lower rate of inflation.
However some have argued that this will be offset by the additional disposable income lower gas-bills will provide to Australian households. If they spend less on gas, they will be able to splurge on other goods helping to keep their prices high. So even though gas prices will fall, we might see an increase in inflation if the spending splurge offsets the lower energy prices intended by the policy.
It takes a model
To answer this question, we need a general equilibrium model that can measure both effects at the same time. Fortunately, the Reserve Bank of Australia has published one such model by Rees, Hall and Smith.
How would a gas price cap be included in the RBA’s model? While the model does not have a specific gas sector, it does have a resource sector which represents Australia’s exports of iron ore, coal and gas. Helpfully while the mining sector is primarily export-orientated the model allows for a small share of its output to be provided to non-mining domestic firms as an input in their production process. Thus the model is able to include the use of coal and gas as a power source, or the use of iron ore in locally produced steel.
A straightforward interpretation of the gas price cap would be an intervention that lowers the price of gas sold to domestic firms - while keeping the price of exported gas unchanged. The price cap thus lowers the cost of production for Australian firms, such as manufacturing businesses who might also export their goods (in model-ese non-resource, traded goods) or the power retailers who power Australian homes (non-traded goods).1
The following graphs shows the marginal impact if the domestic gas price is capped for a year (ie 4 quarters) over the next 20 quarters or 5 years. The headline result is that inflation falls in response to the decrease in gas prices.2
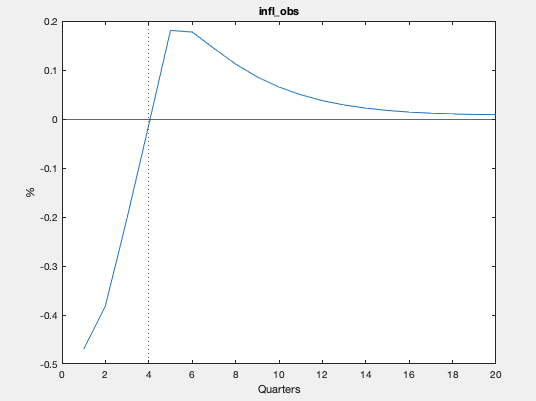
This fall captures the direct effect of firms being able to charge a lower price on the goods and they otherwise would have as the cost of gas decreases. But it is also driven by the fall in inflation expectations. Because firms expect inflation to be lower over the next 4 quarters they face less pressure to increase their prices today to keep up with their competitors.
We do see an increase in inflation once the price cap ends after the four quarters. While this is mostly driven by the gas price returning to its previous level, the additional spending power provided to Australian households also drives inflation higher. This is best seen by the below figure showing firms’ marginal costs, which are shown in level terms (unlike the inflation figures which are in growth terms).

Even once gas prices return to normal after 4 quarters, firms still face slightly higher demand for their products which pushes their marginal costs higher - above the initial level prior to the price cap.
However the overall impact of the policy is still deflationary. The disflation of the first four quarters outweighs the slightly higher inflation after the price cap is lifted. That means if that gas price was slowly allowed to rise (instead of instantly ending after the year as I’ve assumed) the uptick in inflation could be avoided.
Unsurprisingly when costs are lowered there is a increase in non-traded output (see figure below) which lasts for a couple years, so we should expect the unemployment rate to be marginally lower as firms employ more workers.

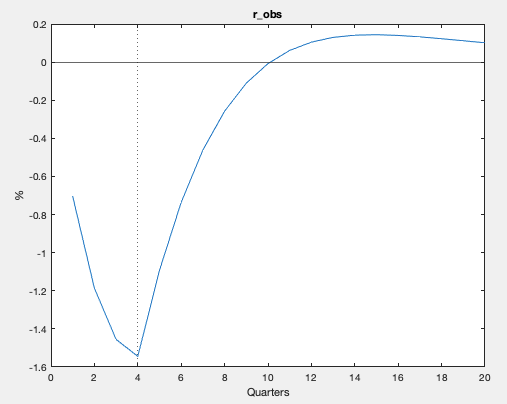
Given that inflation is lower while output is higher it is not immediately clear how this should impact on interest rates as the former calls for lower rates and the latter higher ones. But weighing the two effects together the model predicts that interest rates will be lower than they otherwise would be in the response to the gas price cap.
A policy that trades lower inflation today, for slightly higher inflation in 2024 or beyond, will be be welfare improving from a macroeconomic perspective as it helps avoid inflation spiralling higher today when it is already high and helps keep inflation expectations for the future in check.
No free lunch
That is not to say the policy is without any costs. Just that most of the costs are microeconomic in nature, not macroeconomic. Capping gas prices might well discourage future investment in gas or other mining projects. If firms believe that future price caps are more likely to occur in the future, this policy could act as a “tax on gas projects” - leading to fewer gas projects being started today.
But if you believe that the government's overriding objective should be to lower the rate of inflation and help return it to target, then a gas price cap will help.
Since international prices are unchanged, I’ve assumed that there is no direct impact on mining exports or employment, as the marginal value of an additional unit of extraction is unchanged when sold overseas. Mining exports and employment do fluctuate due to changes in wages and the real exchange rate, however.
I wouldn’t take the quantitative results on the y-axis too seriously, given the rough calibration of the shock. Focus on the qualitative story!